A pool's return on investment ranges from 0% in cold-climate states to 80–100% in Florida and Arizona, with a national average around 56%. Climate is the biggest driver: states with 200+ pool-season days see the strongest returns, while states below roughly 120 days rarely recover the cost at resale. Neighborhood pool saturation and home price tier also shift the number significantly.
Whether a pool adds value to your home isn't a yes-or-no question — it's a zip-code question. A pool in Phoenix adds measurable, reliable home value. The same pool in Minneapolis can actively reduce your buyer pool and complicate a sale. The ROI of a swimming pool is driven primarily by climate, followed by neighborhood norms and price tier. Below is a complete breakdown of all 50 states plus the District of Columbia, with estimated pool season length alongside each ROI figure, followed by the factors that matter most.
Pool ROI by State: The Data
The table below covers all 50 states and the District of Columbia, sorted from strongest to weakest return. Figures reflect estimated value-add as a percentage of home sale price, based on 2025–2026 real estate data from Zillow, Redfin, and National Association of Realtors pool premium studies. ROI assumes a mid-range pool build ($65,000–$80,000) in a median-priced home for that market. Pool season is the approximate number of days per year the water sits above 78°F without heating — the single strongest predictor of resale premium.
| State | ROI Range | Value Added | Pool Season days/yr | Notes |
|---|---|---|---|---|
| Florida | 7–8% | $28K–$60K+ | 300 | Year-round use; pool expected in many neighborhoods; strongest ROI in the US |
| Arizona | 6–8% | $25K–$50K | 240 | Pools are a near-standard amenity in Phoenix/Scottsdale; strong resale premium |
| California | 6–7% | $40K–$80K+ | 200 | Southern California is strongest — high home prices amplify percentage gains; Bay Area and northern counties run 2–3 points lower |
| Texas | 5–7% | $22K–$45K | 210 | Long summers; strong in DFW and Houston suburbs; Houston's humidity drives demand |
| Nevada | 5–7% | $20K–$40K | 200 | Las Vegas metro has strong pool culture; extreme heat makes pools a necessity |
| Hawaii | 5–6% | $35K–$60K | 330 | High baseline home values; pools are expected on higher-end properties |
| Louisiana | 4–6% | $15K–$30K | 210 | Long hot season; strongest in Baton Rouge and New Orleans suburbs; flood-zone lots can offset the premium |
| Georgia | 4–6% | $18K–$35K | 180 | Atlanta suburbs have strong pool demand; rural areas show less premium |
| South Carolina | 4–6% | $16K–$32K | 175 | Charleston, Myrtle Beach and Greenville suburbs show a consistent premium |
| Alabama | 4–5% | $13K–$26K | 180 | Birmingham and Gulf Coast markets recover the most; north Alabama runs lower |
| New Mexico | 4–5% | $13K–$26K | 175 | Hot, dry climate makes pools desirable; Albuquerque and Las Cruces lead the state |
| Mississippi | 3–5% | $10K–$22K | 185 | Long season, but low median home values cap the dollar value added |
| North Carolina | 3–5% | $15K–$30K | 160 | Charlotte and Raleigh see consistent premium; mountain areas less so |
| Virginia | 3–5% | $15K–$35K | 150 | Northern Virginia high-value market shows better returns than state average |
| Arkansas | 3–4% | $10K–$20K | 170 | Decent season length; premium concentrated in Little Rock and Northwest Arkansas |
| Oklahoma | 3–4% | $10K–$20K | 165 | Oklahoma City and Tulsa suburbs show steady demand; hail risk is a buyer concern |
| Tennessee | 3–4% | $12K–$25K | 155 | Nashville's growth supports the premium; East Tennessee's shorter season lowers it |
| Maryland | 3–4% | $12K–$28K | 145 | Good summer use season; coastal areas show stronger returns |
| Delaware | 2–4% | $9K–$20K | 145 | Coastal Sussex County beach markets carry most of the state's premium |
| New Jersey | 2–4% | $10K–$25K | 140 | Dense suburbs vary widely; premium strongest in high-price Shore-area towns |
| Utah | 2–4% | $10K–$22K | 130 | St. George and southern Utah are strong outliers; Wasatch Front season is short |
| New York | 2–4% | $8K–$25K | 120 | Long Island and Westchester show real premium; NYC boroughs: minimal impact |
| District of Columbia | 2–3% | $10K–$25K | 150 | Very high home values, but small urban lots make pools rare and hard to comp |
| Kansas | 2–3% | $7K–$15K | 145 | Short but hot season; buyers weigh winterization cost against summer use |
| Kentucky | 2–3% | $7K–$15K | 145 | Louisville and Lexington recover part of the cost; rural markets rarely do |
| Missouri | 2–3% | $7K–$16K | 145 | Kansas City and St. Louis suburbs are the only reliable premium markets |
| Connecticut | 2–3% | $10K–$25K | 125 | Fairfield County's high home values carry the state; premium fades north |
| Illinois | 1–3% | $5K–$15K | 130 | Short summer season limits value-add; buyer concern about maintenance cost |
| Pennsylvania | 1–3% | $5K–$15K | 125 | Philadelphia's Main Line suburbs are the exception; most of the state is below cost |
| Rhode Island | 1–3% | $6K–$16K | 125 | Coastal towns show modest premium; short season limits broader demand |
| Massachusetts | 1–3% | $8K–$22K | 120 | High home values soften the loss, but the season is too short to add real value |
| Colorado | 1–3% | $6K–$18K | 110 | High home values but a short season; heated pools are common and costly to run |
| Indiana | 1–2% | $4K–$11K | 130 | Below-cost returns statewide; Indianapolis suburbs perform slightly better |
| West Virginia | 1–2% | $4K–$10K | 130 | Low home values and hilly lots make in-ground pools a poor value bet |
| Ohio | 1–2% | $4K–$12K | 125 | Below-cost ROI in most markets; can complicate sale if buyers see liability |
| Nebraska | 1–2% | $4K–$10K | 120 | Omaha and Lincoln see limited demand; long winterization period deters buyers |
| Idaho | 1–2% | $5K–$12K | 110 | Boise's growth is lifting demand slightly; statewide returns remain below cost |
| Oregon | 1–2% | $5K–$14K | 100 | Cool Willamette Valley summers; southern and eastern Oregon do modestly better |
| Washington | 1–2% | $5K–$15K | 95 | Pacific Northwest summers are mild and short; eastern Washington runs warmer |
| Iowa | 0–2% | $0–$8K | 115 | Pools are unusual outside the largest metros; most builds do not recover cost |
| Michigan | 0–2% | $0–$8K | 105 | Pools can narrow buyer pool in cold markets; lake-access areas slightly better |
| New Hampshire | 0–2% | $0–$9K | 100 | Lakes Region homes compete with natural water access; pool premium is minimal |
| South Dakota | 0–1% | Minimal | 105 | Very short usable season; pools are rare and often seen as a maintenance liability |
| Wisconsin | 0–1% | Minimal | 100 | Similar to Minnesota; below-cost returns in virtually all markets |
| Minnesota | 0–1% | Minimal | 95 | Short usable season; pools are unusual; maintenance cost perception outweighs value |
| North Dakota | 0–1% | Minimal | 95 | Among the shortest pool seasons in the country; effectively no resale premium |
| Vermont | 0–1% | Minimal | 95 | Rural, cold-climate market; pools are a lifestyle purchase, not an investment |
| Maine | 0–1% | Minimal | 90 | Coastal and lake access reduce pool demand; returns are effectively zero |
| Montana | 0–1% | Minimal | 90 | Short season and low pool density; buyers often view pools as a cost centre |
| Wyoming | 0–1% | Minimal | 90 | Sparse market with almost no pool comps; appraisers rarely assign added value |
| Alaska | 0% | Minimal | 40 | Outdoor pools are impractical; indoor pools are a niche luxury with no reliable premium |
What Drives Pool ROI
1. Climate (most important factor)
Pool ROI is almost perfectly correlated with the number of pool-season days per year. States with 200+ days of pool weather (water above 78°F) see the strongest returns. Below 120 days — the rough threshold in states like Illinois and Michigan — pools rarely recover cost at resale.
2. Neighborhood saturation
In neighborhoods where 40–60% of homes have pools, a property without one is considered "under-improved" for the area. Buyers in these markets expect a pool; not having one is a disadvantage. In neighborhoods where pools are unusual, the premium is smaller because buyers haven't priced one in.
3. Price tier
Pool premiums tend to be larger in higher-priced homes. A $600,000 home with a pool commands more of a premium than a $250,000 home with the same pool — partly because buyers at higher price points expect outdoor amenities, and partly because the pool represents a smaller fraction of total purchase price. In the entry-level market, buyers often see pools as a maintenance burden they can't afford.
4. Pool condition and age
A well-maintained 5-year-old fiberglass pool adds value. A 20-year-old concrete pool with a deteriorating plaster surface, outdated equipment, and deferred maintenance can subtract value — buyers will price in the cost of bringing it up to standard. Pool inspections (typically $150–$300) are now common in states where pools are standard; a failing inspection kills deals.

How to Use Pool Potential in Real Estate Marketing
For homeowners in states where pool ROI is clear, the value case is straightforward: get the pool built, maintain it well, and expect a premium at sale. But there's a less obvious opportunity for sellers in mixed-climate markets: marketing the yard as pool-ready to buyers who want to add one themselves.
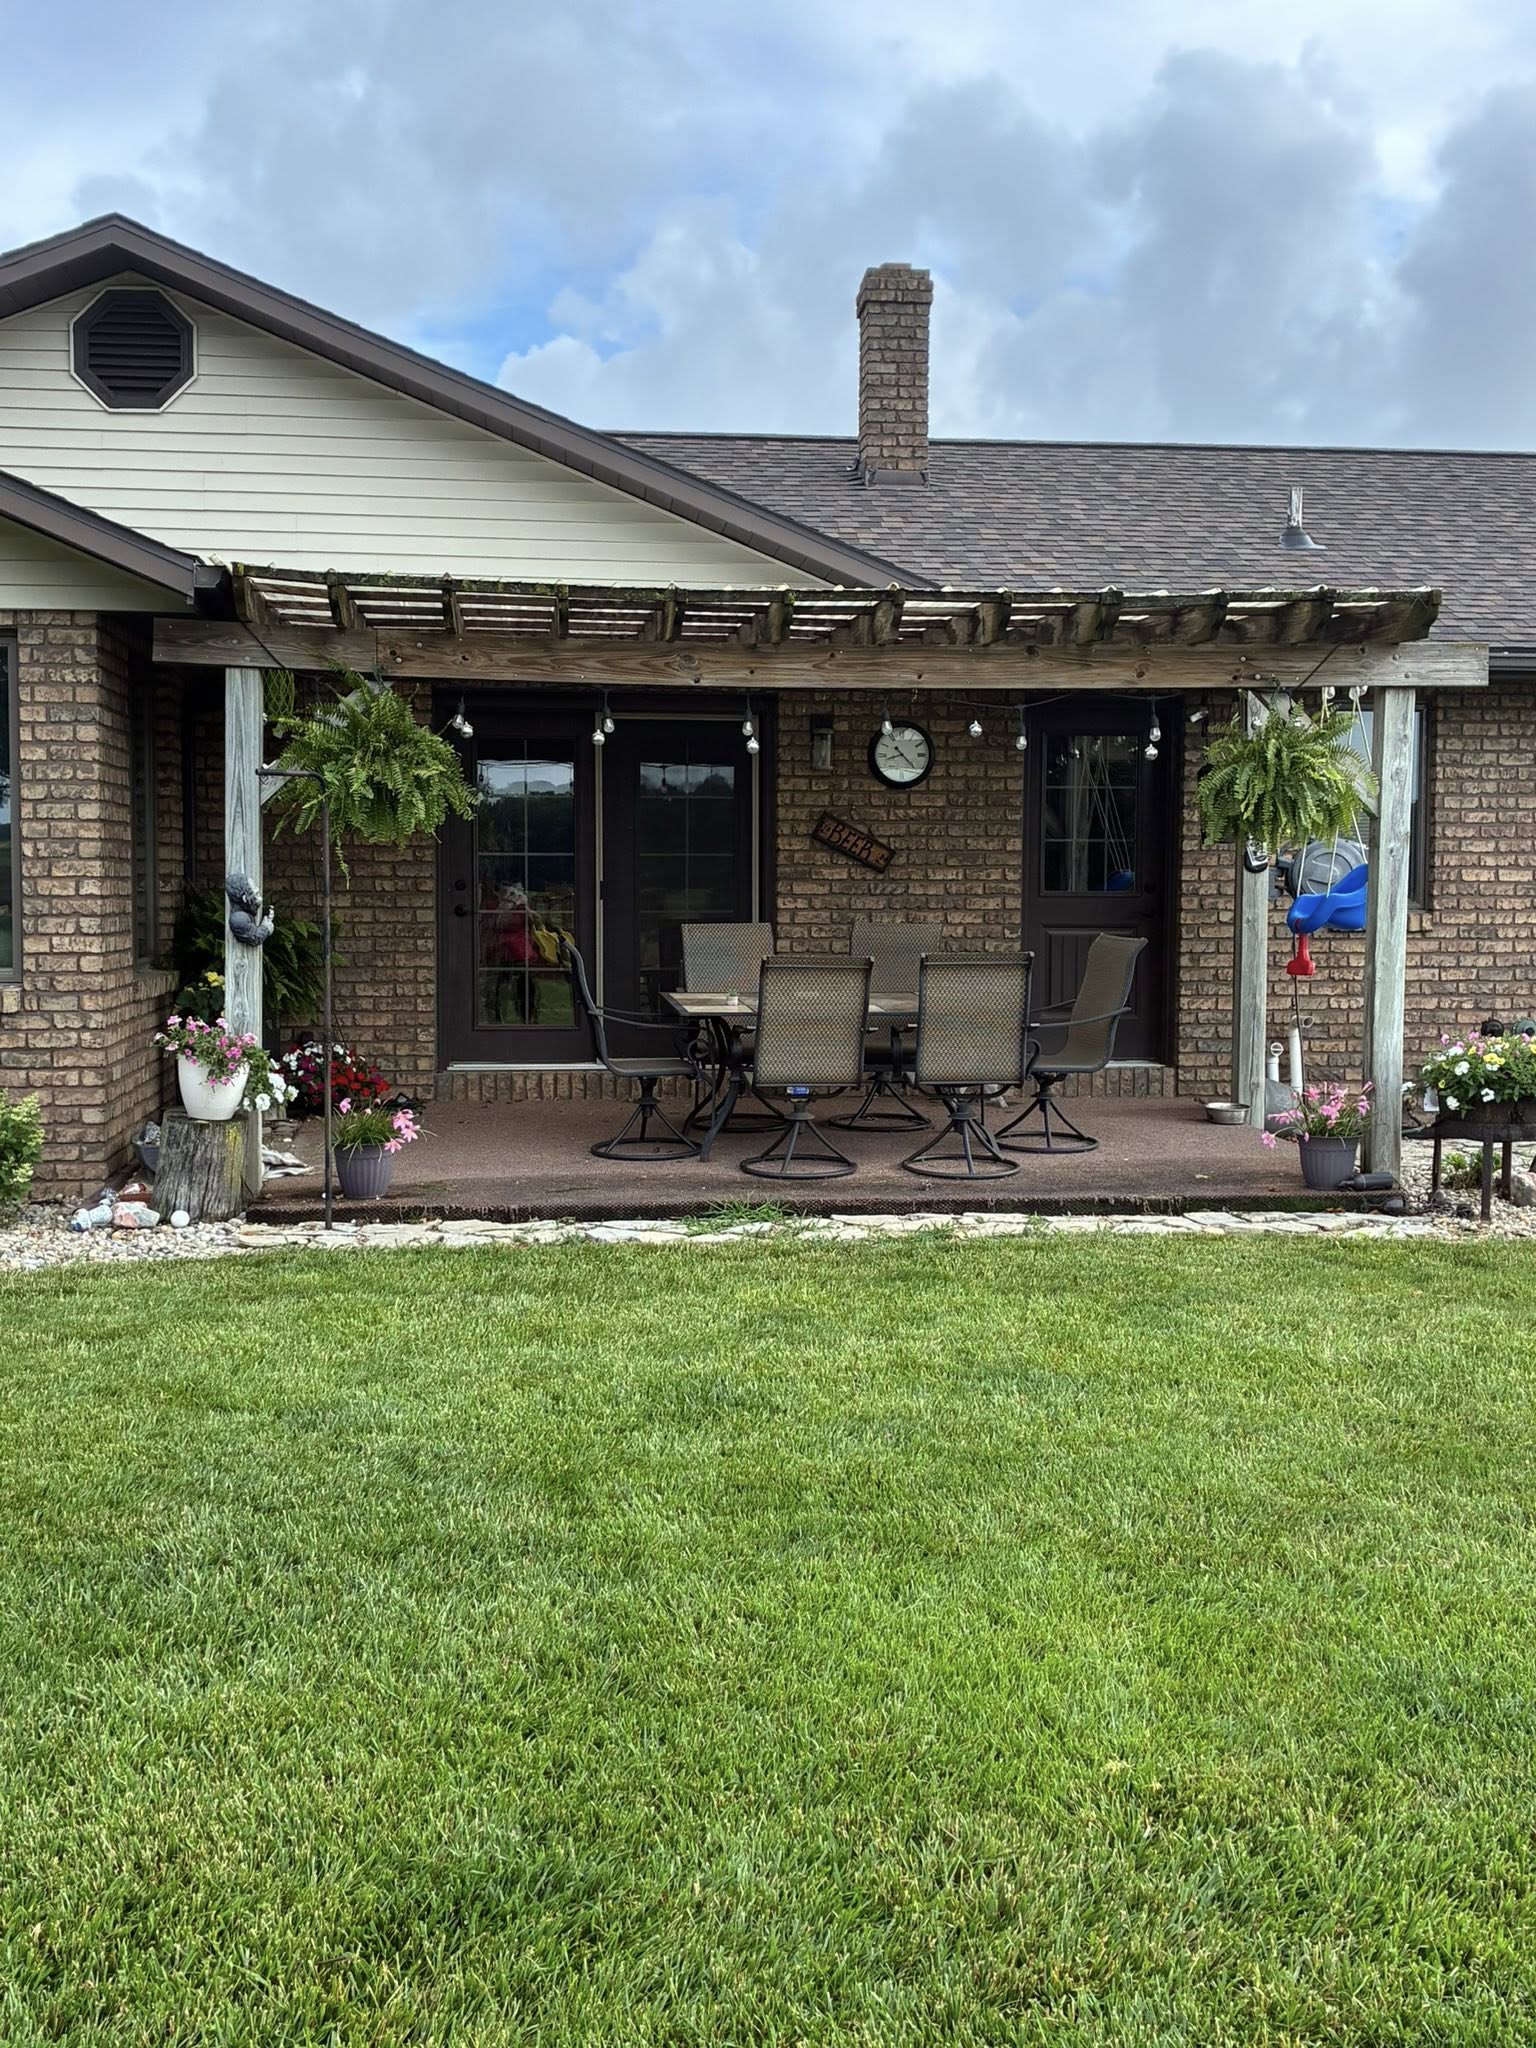
A home with a large, south-facing yard, good setbacks, and no obstructions can be marketed to buyers who are planning to add a pool — especially if you can show them exactly what it would look like. AI pool visualization lets agents generate a satellite render of the specific yard with a pool in place, removing the buyer's imagination from the equation and replacing it with a photorealistic preview.
This is the "pool potential" story that works in any market — not "here's a pool you'll have to maintain" but "here's what your yard could become, and here's proof it works spatially." For more on this strategy, see how real estate agents use pool visualization to close listings.
The Case for Building in a High-ROI State
If you're in Florida, Arizona, Texas, or Southern California and you're debating whether to build a pool, the ROI math usually supports it — especially if:
- You plan to own the home for 5+ years (you get years of use plus the resale premium)
- Your neighborhood has 30%+ pool penetration (pools are a market expectation)
- Your yard has good space for a mid-size pool (15 × 30 ft or larger) with attractive deck and landscaping
- You choose a material with low long-term maintenance cost (fiberglass is the lowest)
If you're in a cold-climate state and planning to sell within 3–5 years, the math rarely supports a new pool build for ROI purposes. You'd be better served by landscaping and outdoor living improvements that appeal to a wider buyer pool.
See the Pool Potential Before You List
Whether you're building a pool or marketing a yard that could have one, USAIPools generates a photorealistic satellite render in under 60 seconds — free for your first 3 renders.
Try It Free